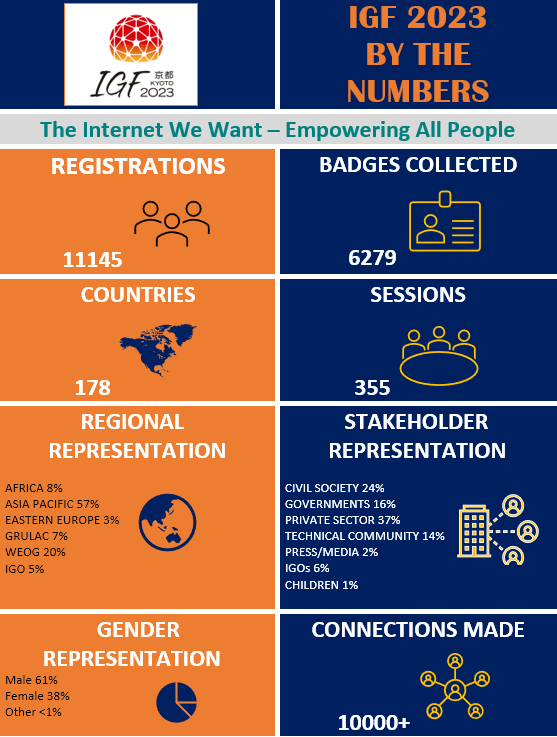
The Eighteenth Annual Meeting of the Internet Governance Forum (IGF) was hosted in a hybrid format by the Government of Japan in Kyoto from 8 to 12 Octover 2023, under the overarching theme: The Internet We Want - Empowering All People. The IGF 2023 Outputs are available.
The 18th annual IGF meeting received a record number of 11,145 registered participants. At the IGF venue in Kyoto, 6,279 participants collected their badges and participated onsite in the meeting. Over 3,000 stakeholders participated online, making the total participation at the 18th annual IGF meeting over 9,279. The majority of onsite participants came from Japan, China, United States of America, Nepal, Brazil, Sri Lanka, Germany, United Kingdom of Great Britain and Northern Ireland, India Kenya, Cambodia and Australia. Most of online participants connected from Japan, United States of America, India, Nigeria, China, Philippines, Australia, Germany, France and Ghana.
67% participants indicated they were participating for the first time.
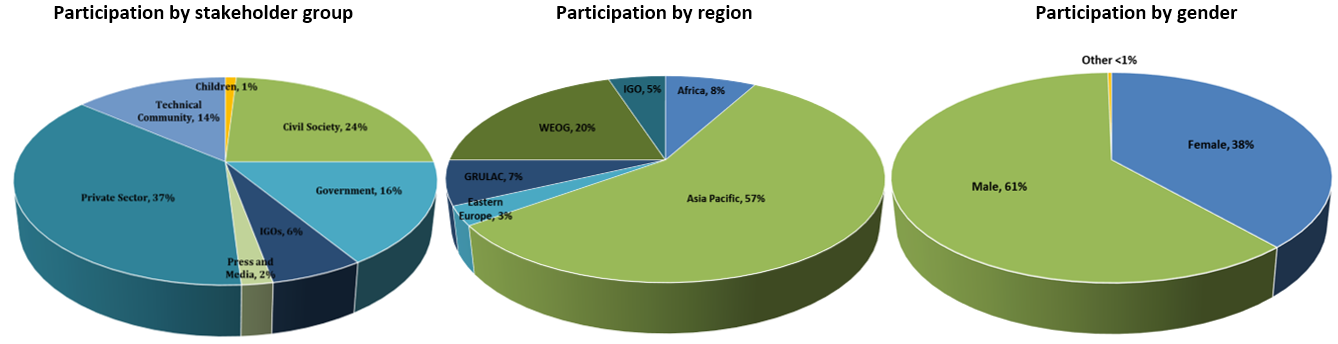
Gender representation was 61% male, 38% female and less than 1% self-identified as other.
About 3% of registered participants indicated they were members of parliaments from 38 different countries.
2% of registered participants were media representatives. The biggest number of participants came from the private sector (37%) and civil society (24%), followed by Governments (16%), the technical community (14%), intergovernmental organizations (6%) and press (2%).
In terms of regional diversity, the majority of participants came from Asia Pacific (57%), followed by WEOG (20%), Africa (8%), GRULAC (7%), Eastern Europe (3%) while 5% indicated to be members of the intergovernmental organizations.
Below are the visual breakdowns of all participants per stakeholder group, region and gender.
Compared to IGF 2022, this year’s IGF saw an increase in representation of the participants coming from the private sector (+11%); and in representation of stakeholders from the Asia Pacific region (+32%). The number of stakeholders from Africa was significantly lower than in 2022 (-36%), when the IGF was held in that region.
Regarding participation by the level of development of the country, based on the latest available HDI Index , there were about 53% from developed countries classified as "very high", and 47% from developing countries, not classified as "very high", with the stakeholder distribution as illustrated on the graph below.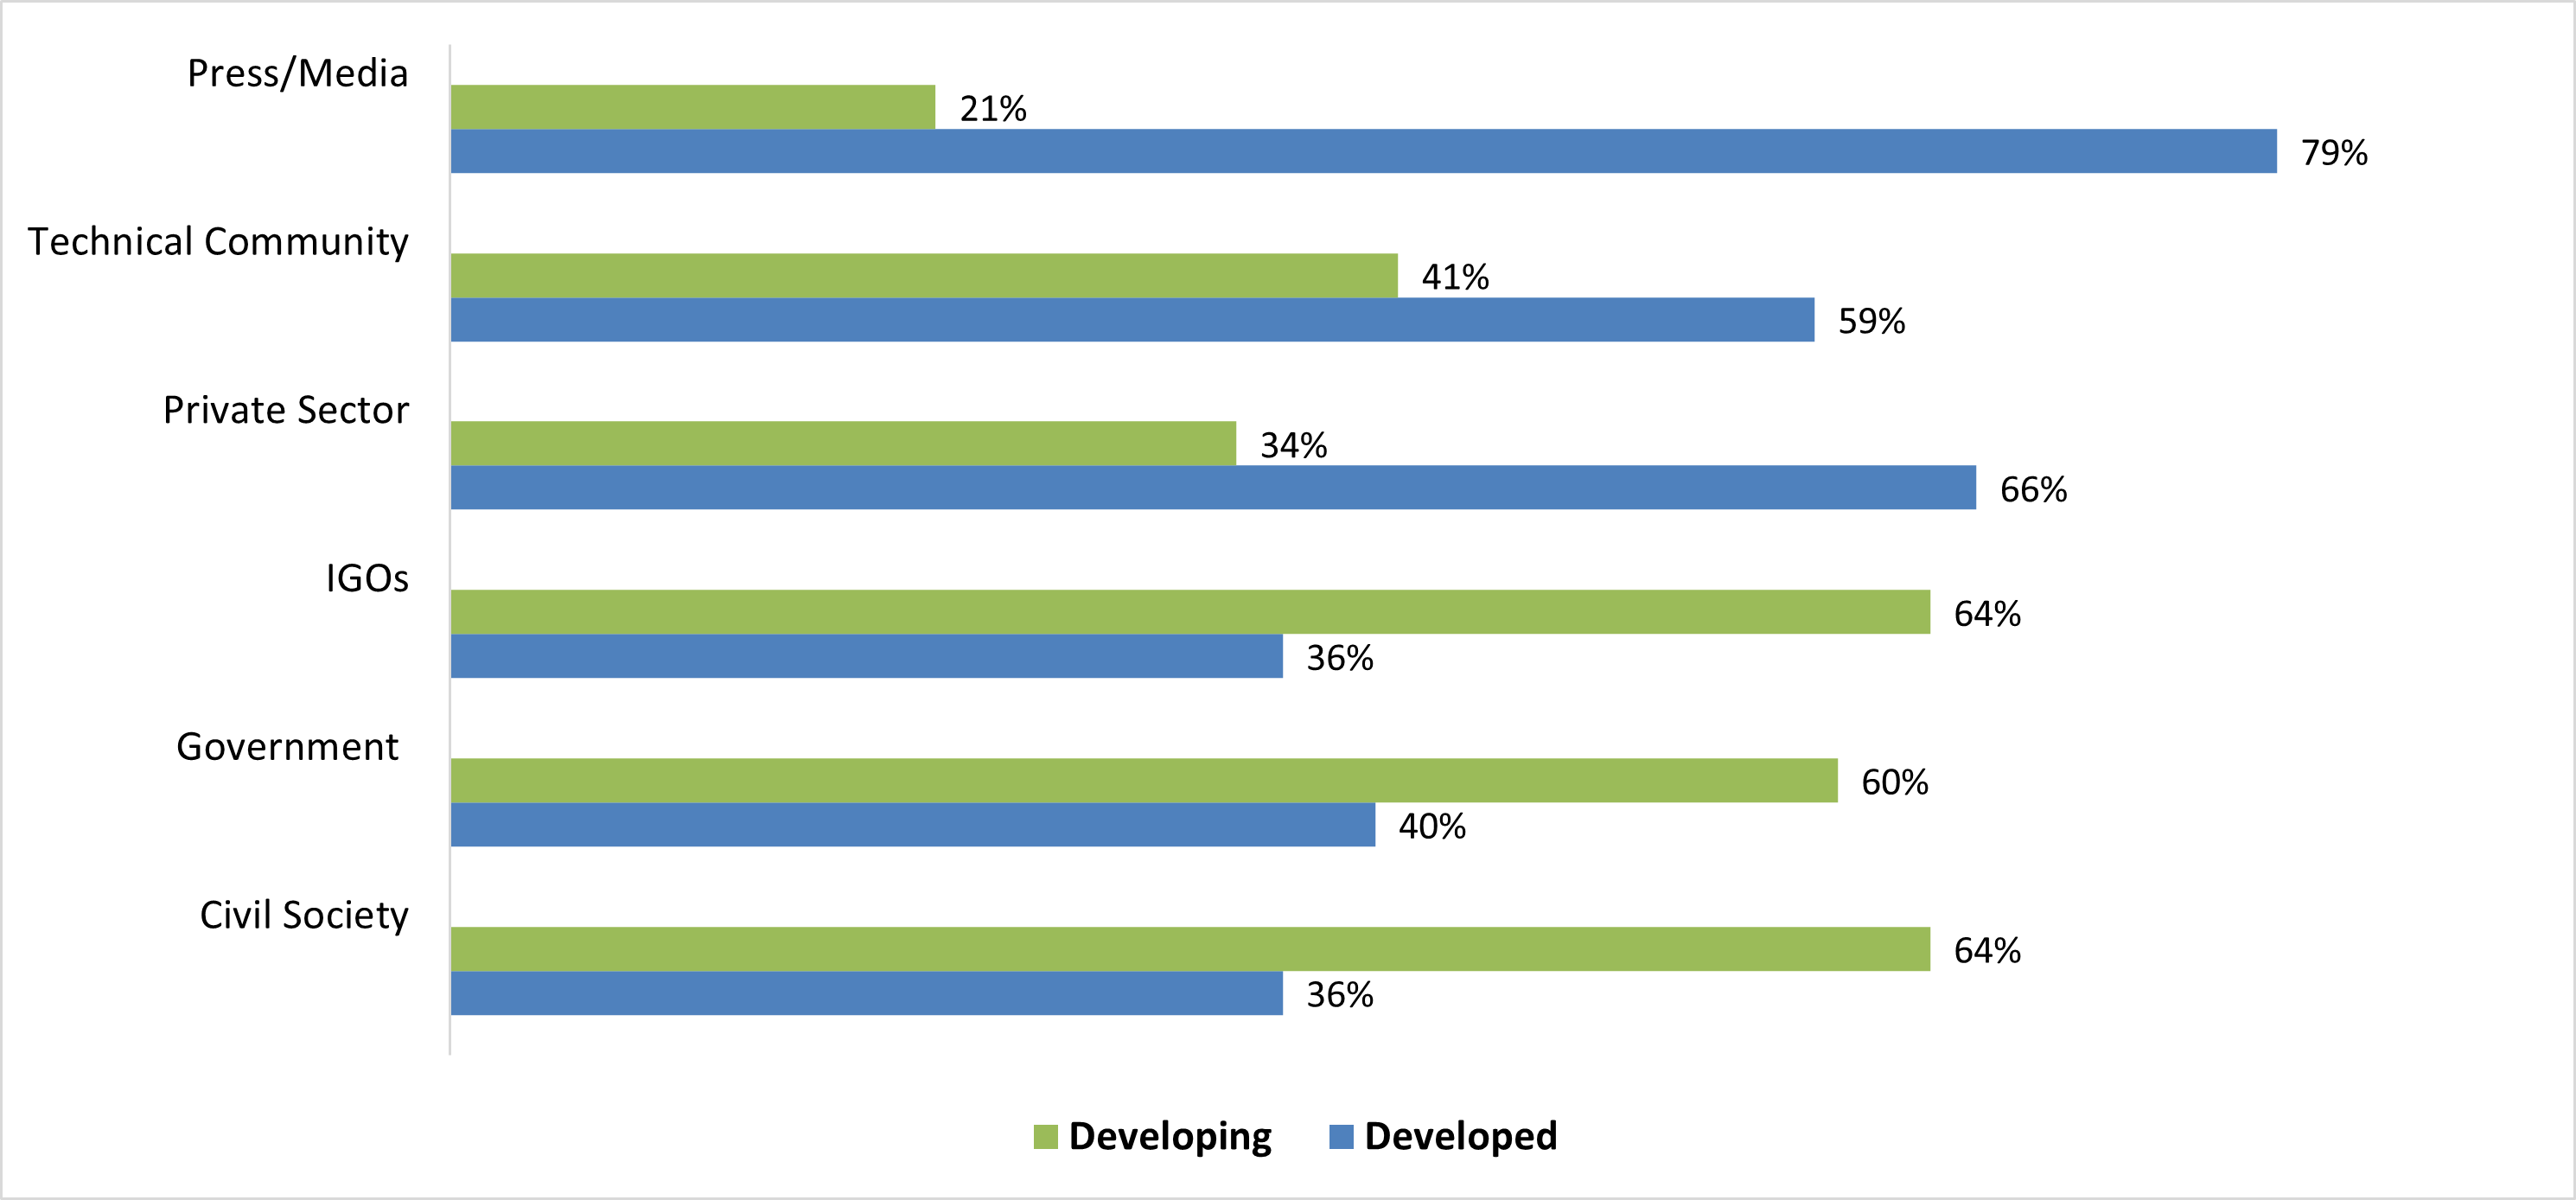
The meeting’s live stream service attracted over 10,000 unique views. Over 70% of viewers were between 18 and 44 years of age. Livestreams were mostly viewed in Japan (+53%), followed by Indonesia, India, the United States and Saudi Arabia.
Week-of media monitoring showed that the IGF was covered in a very high number of major Japanese media outlets, including NHK, Nikkei, Yomiuri Shimbun, Asahi Shimbun, Mainichi and Kyoto, in print and broadcast. It appeared in international outlets such as Politico, Deutsche Welle, La Stampa and EU Reporter. Services in Indonesia, Georgia, Nigeria, Hungary and other countries also picked up IGF-related stories.
The meeting featured 355 sessions. Breakdowns per session type were: 1 Opening Session, 1 Opening Ceremony, 6 Main Sessions, 78 Workshops, 58 Open Forums, 20 Town Halls, 21 Launches and Awards, 44 Lightning Talks, 23 Networking Sessions, 24 DC Sessions, 3 NRI Collaborative Sessions, 45 Pre-Events (Day 0 Sessions), 5 High-level Leaders Track, 4 Parliamentary Track sessions. 1 Global Youth Summit, 1 BPF Sessions, 3 PN Sessions, 3 other sessions, 1 Open Mic and 1 Closing Ceremony.
Organizations from five different continents joined the IGF Village with 80 booths to share their work missions with the Forum’s participants. The Village included representatives from all key stakeholder groups: governments and intergovernmental organizations, private sector, civil society and technical community.
There were also 34 remote hubs organized around the world from 24 different countries: 60% in Africa; 23% from Asia Pacific; 11% in Latin America and the Caribbean; and 6% in WEOG.